Tracing Evolutionary Patterns in Live Event Coverage Within Gambling Analysis Portals
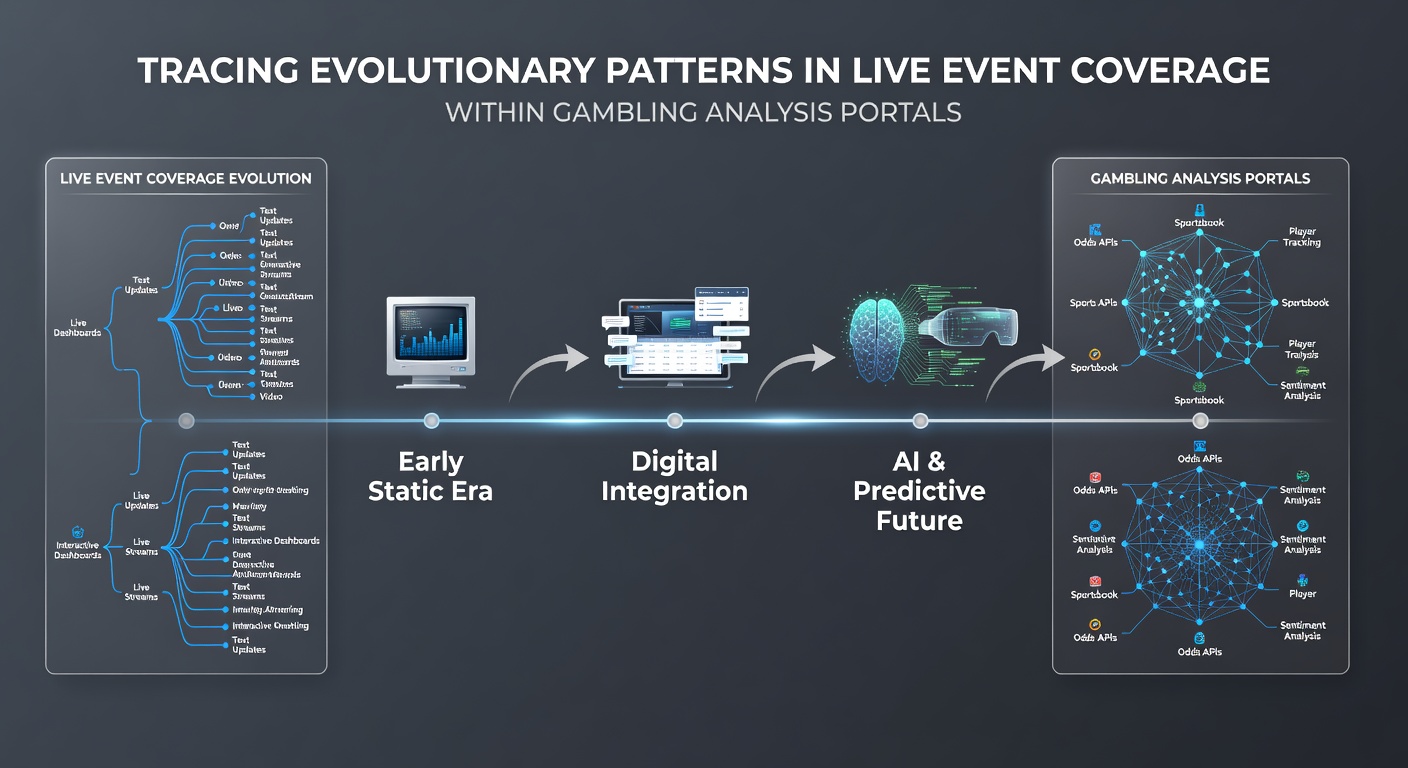
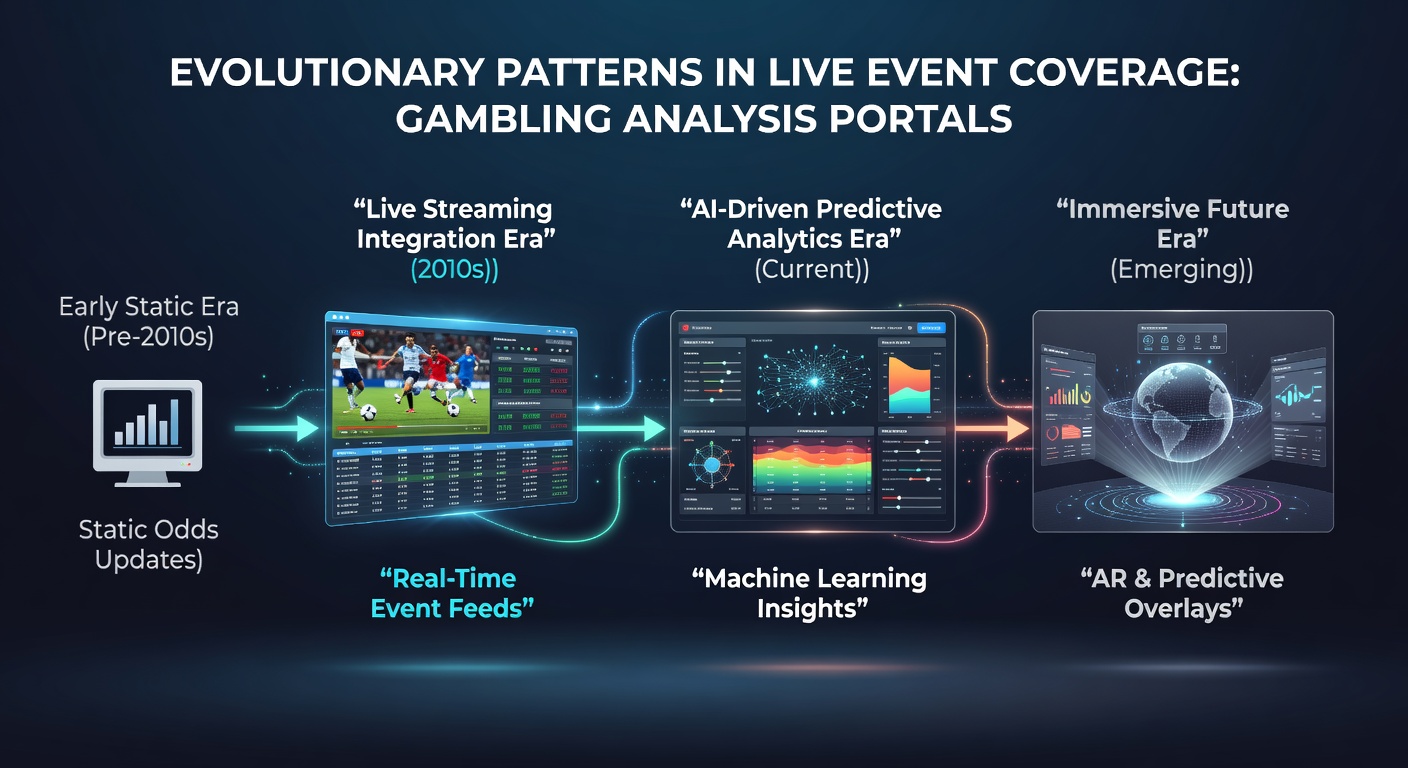
Live event coverage in gambling analysis portals has shifted from simple score tickers to layered systems that combine data feeds, statistical overlays, and predictive indicators, and these changes reflect broader advances in technology along with adjustments in how operators present information to users during ongoing matches or races.
Initial Stages of Coverage Development
Early gambling analysis portals focused on pre-event previews that carried over into basic live sections, where updates arrived through manual score entries and short descriptive notes, yet observers note that this approach limited depth because portals relied on delayed text reports rather than synchronized information streams. Researchers at various academic institutions tracked how these basic formats evolved once broadband connections became widespread, and data shows portals began incorporating live odds adjustments tied directly to in-game events like goals scored or horses passing key markers on the track.
One study revealed that by the mid-2010s many sites had started pulling automated feeds from official sports leagues, and this integration allowed continuous refreshes that replaced earlier static pages with dynamic panels displaying possession percentages, shot attempts, and pace metrics in real time. Those who've studied this progression point out that the move coincided with regulatory changes in several jurisdictions, including updates from the Nevada Gaming Control Board that clarified standards for real-time wagering displays.
Expansion Through Data Layering and Visualization
Portals next introduced visual elements such as heat maps and momentum graphs that updated alongside live feeds, and experts have observed how these tools let readers track patterns like clustering of shots in specific field zones during soccer matches or sectional times in thoroughbred racing. What's interesting is the way developers combined multiple data sources into single dashboards, connecting betting market movements directly to on-field actions so that fluctuations appeared in context rather than as isolated numbers.
According to figures from the American Gaming Association, live betting volumes grew steadily as these layered presentations gained traction, and the same reports indicate that users spent longer sessions on sites offering continuous visual updates compared with text-only formats. Portals also began embedding short video clips or animated replays that synced with statistical callouts, creating a more immersive flow that connected raw event data to betting implications without requiring separate navigation.
Adoption of Predictive and Adaptive Features
By the early 2020s many analysis portals incorporated machine learning models that generated probability shifts during live events, and researchers discovered these systems drew on historical datasets to flag emerging patterns such as fatigue indicators in team sports or track biases in racing meets. The models adjusted outputs as new data arrived, allowing readers to see suggested wager modifications based on calculated likelihoods rather than manual interpretation alone.
Take one research project conducted across European and North American operators that showed how portals refined these tools to account for weather variables or player substitutions in real time, and the findings indicated clearer separation between noise and signal in fast-moving situations. In May 2026 several platforms rolled out enhanced versions that integrated third-party sensor data from stadiums and tracks, producing more granular live coverage that included micro-metrics like individual stride lengths or ball spin rates previously unavailable outside broadcast booths.
Regional Variations and Platform Specialization
Different markets developed distinct emphases within live coverage, with North American portals often highlighting player props and momentum swings while Australian sites focused on pace and sectional analysis for racing events. Government reports from the Australian Communications and Media Authority have documented how these regional preferences shaped feature sets, and similar patterns appear in Canadian provincial data where portals adapted interfaces for hockey-specific live metrics.
Observers note that smaller niche portals sometimes outpaced larger generalist sites by specializing in one sport's live data streams, and this specialization allowed deeper dives into variables like serve patterns in tennis or corner kick distributions in soccer. The result has been a fragmented landscape where users select portals based on the depth of live event layers rather than overall brand size.
Conclusion
Patterns traced across gambling analysis portals show a consistent movement toward integrated, real-time systems that combine official feeds, visual tools, and predictive outputs, and these developments continue as new sensor technologies and regulatory frameworks emerge. Data from multiple regions confirms that coverage depth has expanded alongside increases in live betting participation, while platform differences reflect both technological capabilities and local preferences for specific event types. The trajectory points toward further refinement of adaptive models that respond to event-specific inputs with greater precision.